Country comparison.
Evidence-first comparisons. One indicator, one year, real observations only.
Aligned national comparison
Population / 2025
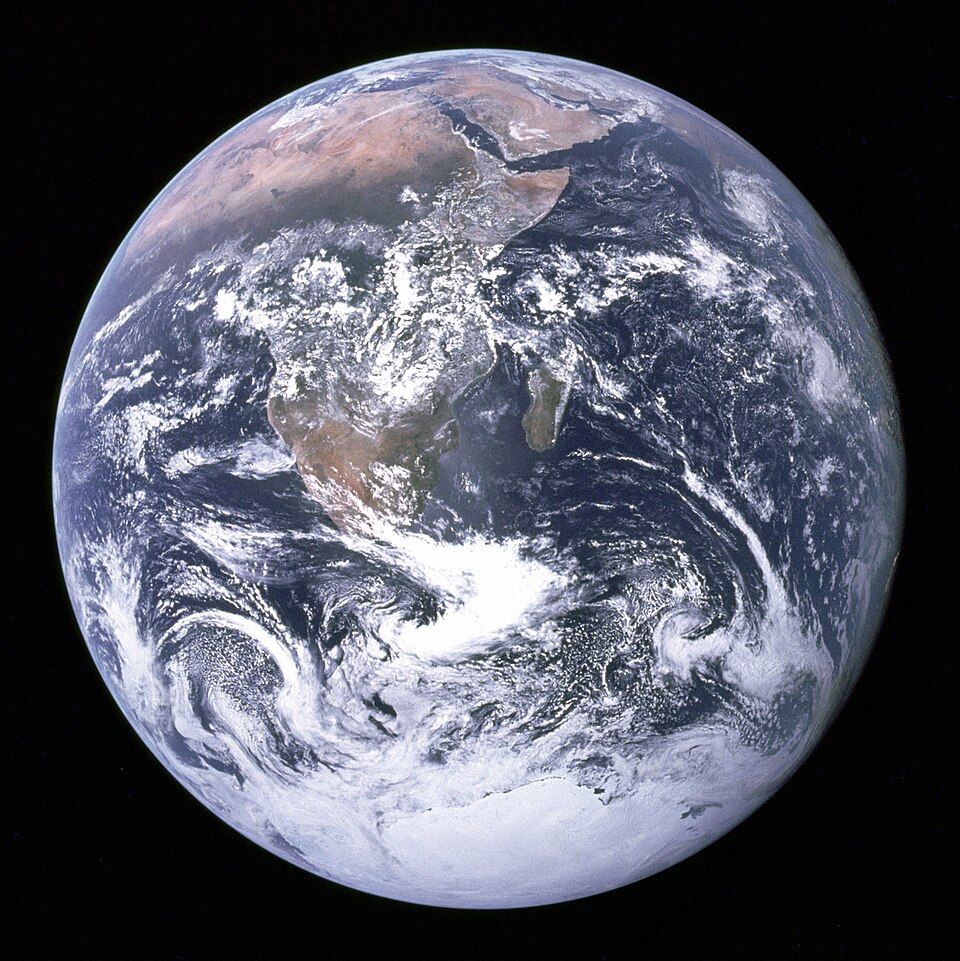
Select countries on the globe to compare them.
No value is invented, interpolated or carried forward.
Magnitude and scale
Bars display values for the same reference year. Signed indicators place negatives left of zero and positives right of zero.
ⓘ Comparison method
Rankings exclude World Bank aggregates and require an exact reference year; data outside the loaded country boundary set is not shown. Source revisions, city definition changes and geopolitical disputes require explicit documentation.
Indicator console
Select an indicator, then load the specified year for the country and territory registry.
No data map loaded.
Global ranking · select indicator
Observed country values, ranked high to low. Click to focus a location.
ⓘ Sources & definitions
Official World Bank JSON endpoint
API parameters and response schema
City statistics are not fabricated from national series. This stage includes location samples, while sourced city data and polygons remain on the production roadmap.
From concept to
global platform.
A phased, acceptance-gated implementation schedule. Dates assume one developer working approximately 15–20 hours per active week. This is a capacity-based forecast with gated releases, not work already completed.
Development schedule — select a phase to inspect delivery gates
Milestone 1 — discovery and technical proof
Work package
Definition of done
Dependencies and risks
Major acceptance gates
- 22 Nov 2026: Geographic picking + provider fallback.
- 20 Dec 2026: Globe interface and country selection.
- 31 Jan 2027: Country statistics and provenance engine.
- 21 Mar 2027: Sourced city records with documented definitions.
- 2 May 2027: Comparison engine and full thematic atlas.
- 23 May 2027: Optional satellite and advanced renderer.
- 13 Jun 2027: Full accessibility and performance QA.
- 18 Jul 2027: Public release subject to gates.
Non-negotiable quality requirements
- Every displayed measurement has geographic identity, year, unit and source.
- Country and city definitions are not silently substituted.
- Map controls work without Google keys or paid imagery.
- Country selection handles small islands, antimeridian cases and disputed borders with documented rules.
- Map legends distinguish missing data, zero and unavailable future years.
- Responsive keyboard-usable interface with reduced-motion support.
- Release criteria are automated and manually audited.
Orbital precision.
Human clarity.
A cinematic geospatial interface inspired by the atmosphere and spatial organisation of God's Eye View, adapted into an original educational and statistical atlas. Visual drama belongs to the planet; numerical accuracy belongs to the data.
Colour and materials
Void
Deep navy
Glass blue
Science cyan
Signal
Highlight
The palette separates navigation and selection (cyan), active geographical focus (brighter cyan), data caveats (warm amber), positive statuses (muted green), and neutral scientific measurements (white). Do not use red as decoration or colour alone to encode data.
Typography scale
Panel engineering
- Globe is full-bleed; panels float over space rather than shrinking the sphere.
- Desktop: left rail 250–280 px, right inspector 320–380 px, bottom time dock.
- Cards use restrained glass blur and 1 px translucent borders.
- Headers remain spatially anchored when camera moves.
- Mobile: collapse both rails into a compact menu and bottom profile sheet.
- Expanded charts use an accessible, solid-background focus state.
Graphic systems
Atmospheric rim
Low-opacity cyan Fresnel glow increases Earth depth without washing out the coastlines.
Geodesic grid
Latitude and longitude gridlines fade with altitude and are switchable.
Focus reticle
Country outlines animate into focus once, then stay static for legibility.
Temporal graphs
Charts share location, metric, year and units with the map state.
City beacons
Cluster at distance, then show compact markers with collision-aware labels.
Choropleth engine
Continuous and diverging scales with missing-data hatching and a real legend.
Timeline ribbon
Frame-by-frame animation limited to actual observations and documented interpolation.
Render governor
Adaptive pixel ratio, suspended animations and reduced-effects settings.
Indicator: SP.POP.TOTL
Year: supplied per observation
Values: not in design mockup
Camera and motion specification
- Focus transition: 650–900 ms with eased acceleration and gentle stop.
- Hover border response: 80–130 ms, no oscillation.
- Inspector reveal: 180–240 ms; never block globe interaction.
- Automatic rotation: 0.5–1.0°/second, stops on user interaction.
- Timeline playback: 1–3 years/second, with adjustable speed.
- Reduced motion: disable spin, flyby, pulses and chart sweeps.
Visual integrity standards
- Never show fabricated figures as official data.
- Atmospheric effects must not distort country or city coordinates.
- Never use a satellite photographic appearance without clearly identifying the actual imagery source.
- Preserve source attribution within all map modes.
- Keep scientific chart axes and units visually prominent.
- Use 30 FPS as a low-end desktop interaction target; aim for 60 FPS on typical supported hardware.